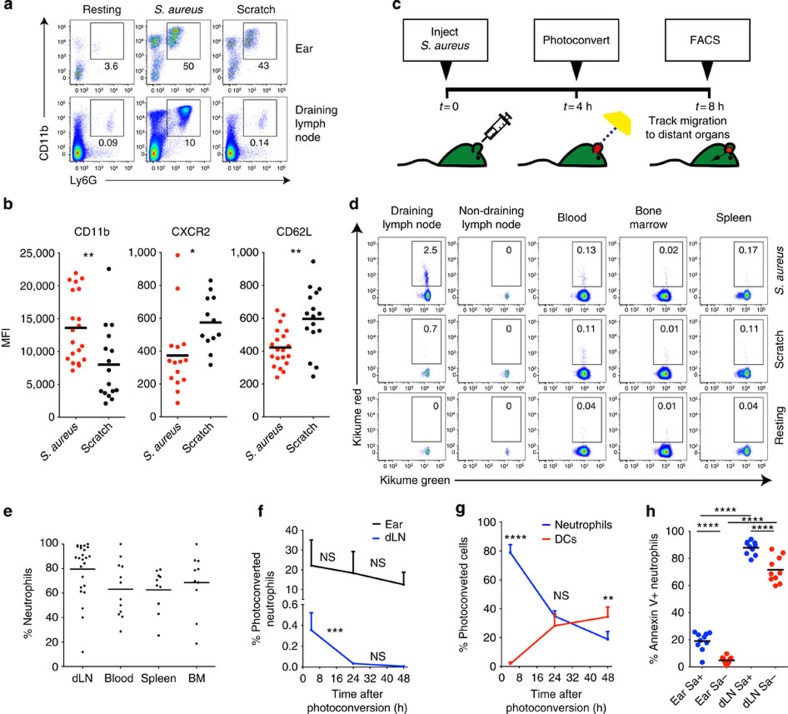
Figure 1. Neutrophils migrate from skin following microbial but not sterile inflammation.
(a) Flow cytometric analysis of mouse ears and draining lymph nodes 8 h after an injection of killed S. aureus (middle panel) or a scratch with a sterile needle (right panel). Percentages of neutrophils (Ly6G+CD11b+) out of all live cells are shown. Resting controls: left panel. Fluorescence-activated cell sorting (FACS) profiles are representative of greater than four independent experiments with at least two mice per group. (b) Cell surface expression of the indicated molecules on neutrophils recruited to skin following an injection of S. aureus or needle scratch was analysed by flow cytometry 8 h after challenge. Each circle represents a single ear. (c) Experimental setup for the detection of skin-emigrant cells. Ears of Kikume reporter mice were either infected with S. aureus or scratched with a sterile needle, and, 4 h later, ears were photoconverted by exposure to white light for 20 min. A further 4 h later, mice were killed and photoconverted cells were detected by flow cytometry. (d) Flow cytometric detection of photoconverted neutrophils after mice were treated as described in c. FACS profiles are representative of at least six independent experiments and are gated on total neutrophils. (e) Proportion of neutrophils out of all photoconverted cells found in each organ using flow cytometry. Kikume mice were injected with S. aureus, photoconverted and analysed as described in c. Each circle represents a single organ. Data were pooled from four independent experiments with at least three mice per group. (f) Percentage of photoconverted neutrophils out of all live cells in ears and draining lymph nodes over time. Mice were infected with S. aureus as in c, photoconverted 4 h later. Means+s.d. are shown. (g) Identity of red cells in draining lymph nodes at 4, 24 and 48 h after photoconversion. DCs, dendritic cells. Mice were infected as in c. Means+s.d. are shown. (h) Percentage of Annexin V+ neutrophils in ears and draining lymph nodes 8 h after injection of fluorescently labelled S. aureus. Each circle represents a single organ. S. aureus (Sa)+ neutrophils (blue), S. aureus− neutrophils (red). Data were analysed using an unpaired student's t-test (b), one-way analysis of variance (ANOVA) with a Bonferroni correction for multiple comparisons (f) or a two-way ANOVA with a Bonferroni correction (g,h). *P≤0.05; **P≤0.01; ***P≤0.001; ****P≤0.0001; NS, not significant.

