
Figure 4.
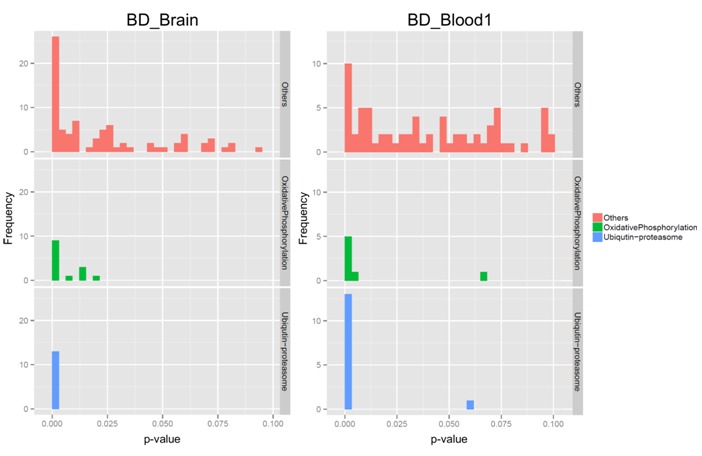
Frequency distribution charts of p-values resulted in GO analysis. In both the studies (BD_Brain and BD_Blood1), GO terms of “oxidative phosphorylation” (middle panels in green) and GO terms of “ubiquitin-proteasome” (bottom panels in blue) showed similar distribution, in comparison with distribution of GO terms representing functions other than “oxidative phosphorylation” and “ubiquitin-proteasome” (top panels in red).