Fig. 1.

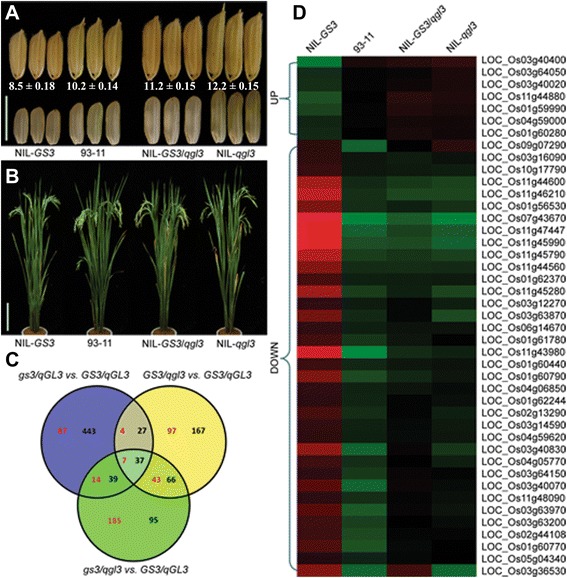
Grains and plants of the NILs and comparison of their expression profiles. a Grains of the three NILs and their genetic background, 93–11. Scale bar, 10.0 mm. b Plants of three NILs and their genetic background, 93–11. Scale bar, 20.0 cm. c Venn diagram of the genes from different comparisons; red numbers indicate up-regulation, black indicates down-regulation. d Expression profiles of the genes commonly regulated by the comparisons gs3/qGL3 vs. GS3/qGL3, GS3/qgl3 vs. GS3/qGL3 and gs3/qgl3 vs. GS3/qGL3
