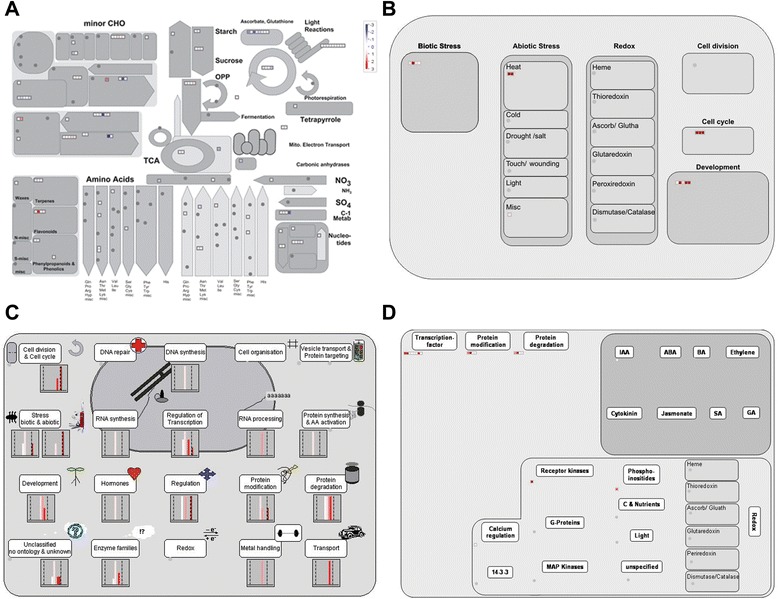
Fig. 3.

Overview of the differentially expressed genes between GS3/qGL3 vs.GS3/qgl3 and gs3/qGL3 vs. gs3/qgl3. a Metabolism overview in MapMan. b Cellular response overview in MapMan. c Cell regulation overview in MapMan. d Regulation overview in MapMan. Red, up-regulation; white, no change; blue, down-regulation
