Fig. 1.

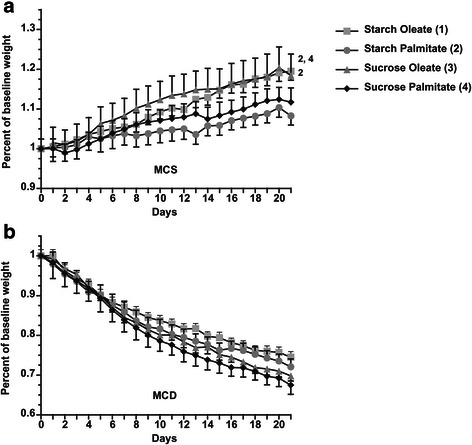
Weight gain/loss on MCS and MCD diets. a 21-day weight curve for mice fed MCS formulas. b 21-day weight curve for mice fed MCD formulas. Values represent mean ± SE for n = 10. Superscripts indicate P < 0.05 vs. comparison groups by number

Weight gain/loss on MCS and MCD diets. a 21-day weight curve for mice fed MCS formulas. b 21-day weight curve for mice fed MCD formulas. Values represent mean ± SE for n = 10. Superscripts indicate P < 0.05 vs. comparison groups by number