
Fig. 1.
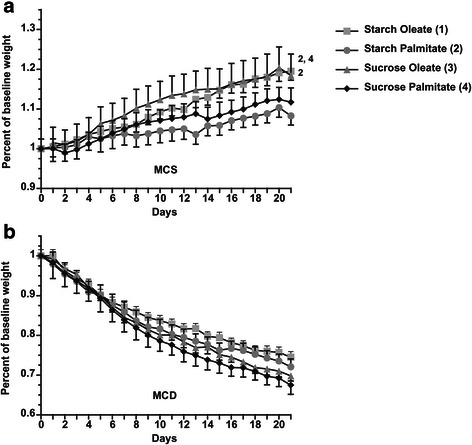
Weight gain/loss on MCS and MCD diets. a 21-day weight curve for mice fed MCS formulas. b 21-day weight curve for mice fed MCD formulas. Values represent mean ± SE for n = 10. Superscripts indicate P < 0.05 vs. comparison groups by number
Official websites use .gov
A
.gov website belongs to an official
government organization in the United States.
Secure .gov websites use HTTPS
A lock (
) or https:// means you've safely
connected to the .gov website. Share sensitive
information only on official, secure websites.
Weight gain/loss on MCS and MCD diets. a 21-day weight curve for mice fed MCS formulas. b 21-day weight curve for mice fed MCD formulas. Values represent mean ± SE for n = 10. Superscripts indicate P < 0.05 vs. comparison groups by number