Fig. 3.

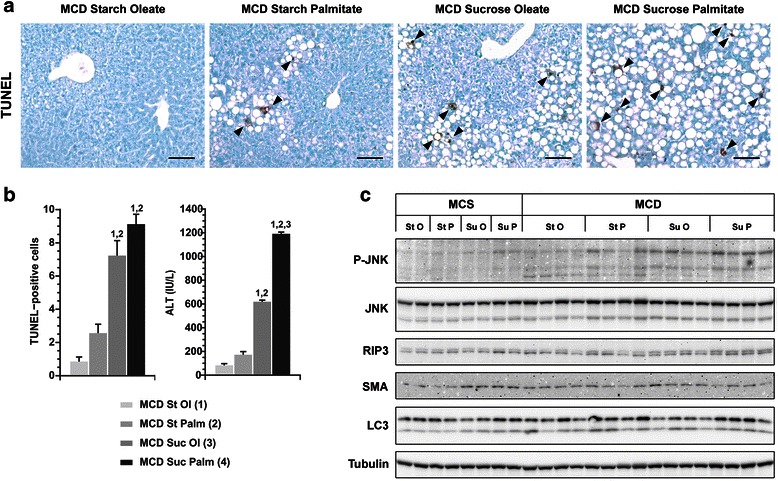
Liver injury in mice fed custom MCD diets. a Photomicrographs illustrate TUNEL staining in mice fed custom MCD formulas for 21 days. TUNEL-positive cells are marked with arrowheads. Bar = 100 μm. There were no TUNEL-stained cells in mice fed MCS formulas over this interval (not shown). b Graphs depict TUNEL- positive cells (average number of cells per 0.4 mm2 section) and serum ALT in MCD-fed livers. Values represent mean ± SE for n = 5 (TUNEL) and n = 10 (ALT). Superscripts indicate P < 0.05 vs. MCD comparison groups by number. c Western blots illustrate JNK phosphorylation and hepatic expression of of RIP3, smooth muscle actin (SMA) and LC3 in MCS- and MCD-fed mice. Tubulin is shown as a loading control. St O = Starch Oleate, St P Starch Palmitate, Suc O = Sucrose Oleate, Suc P = Sucrose Palmitate
