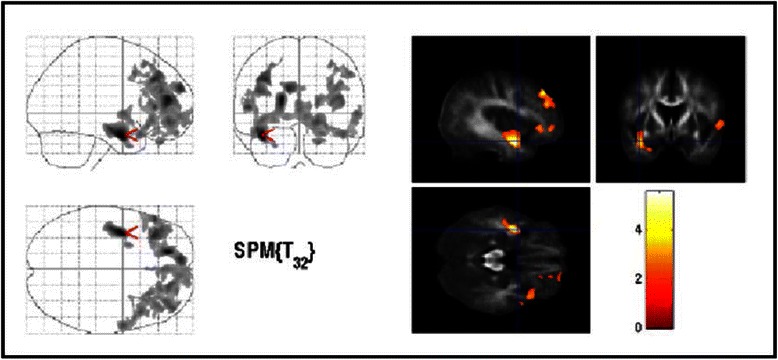
Fig. 1.

Areas of decreased regional fractional anisotropy in OCD patients compared with controls (thresholded at uncorrected P < 0.01, uncorrected, extend threshold 500 voxel). The three orthogonal planes on the left side represent a typical maximum intensity projection “glass brain”, and the set of images on the right side illustrates results superimposed on averaged and normalized FA images of the whole study population in selected planes. The images are shown in neurological convention. The colour bar represents the t-score. Cluster with local maxima were found near the area of the left ventral striatum. Moreover, we found reduced FA in the left medial frontal gyrus as well as in the OFC on both sides
