
Fig. 2.
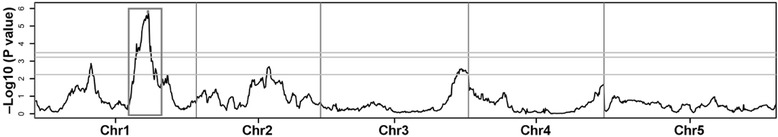
Genome wide association mapping (GWAM) of the resistance to PPV in the MAGIC population. The y axis represent –Log10(P value) obtained for each SNP throughout the five Arabidopsis chromosomes. Chr: chromosome. lsmean of quantitative data were analysed as described in [5, 16]. The threshold P value (dotted line) was calculated by Bonferroni