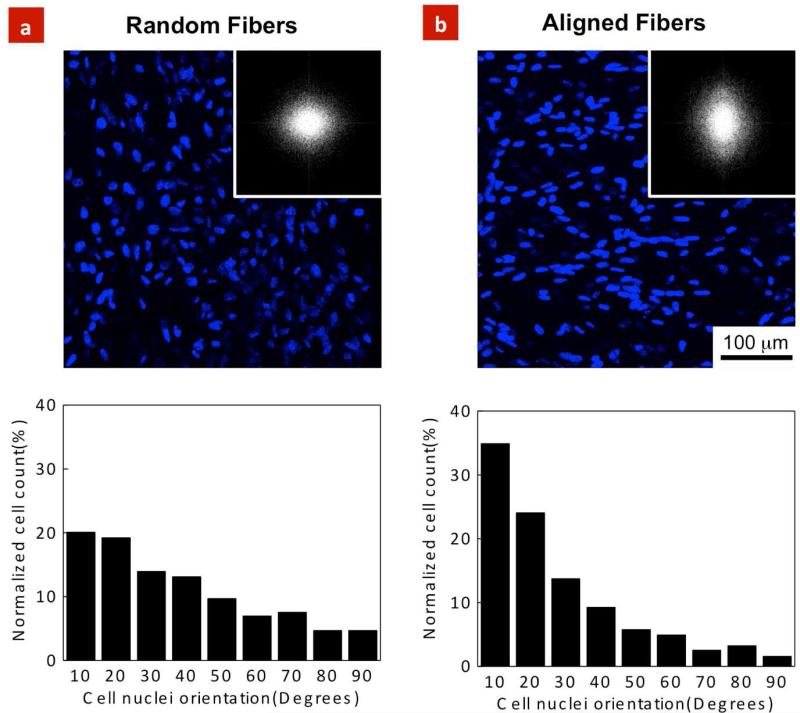
Figure 4. HUVEC alignment on the PGS-PCL scaffolds.
HUVEC nuclei alignment within the random and aligned scaffolds after 7 days of culture; Microscopic images indicated significant role of fiber architecture on cellular alignment. Fluorescence images along with FFT analysis confirmed significantly higher cell nuclei alignment on the (b) aligned scaffolds compare to the (a) random scaffolds. The data represents normalized cell counts calculated from at least 100 cells /images.

