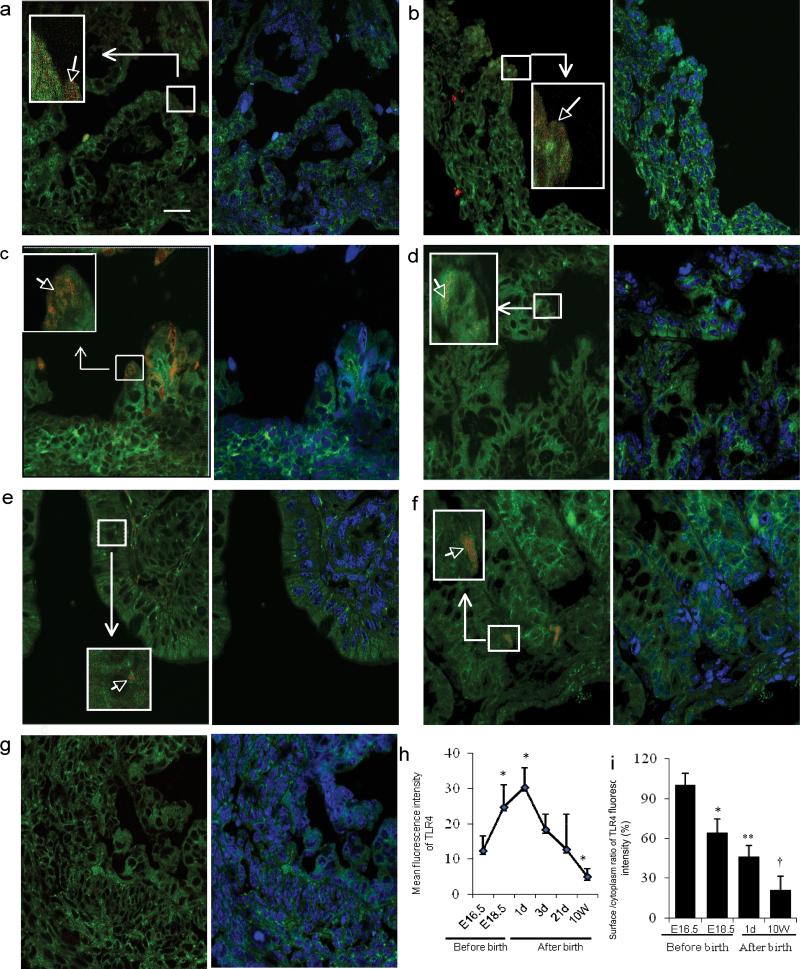
Figure 2.
The ontogeny of TLR4 expression in mouse colonic epithelium during gestation and the postpartum period. Representative confocal image (a-g) left pane: overlayer of mouse colonic tissue stained with a PE labeled anti-mouse TLR4 antibody (red) and counter stained with FITC labeled anti-phospholipids antibody as a cell membrane marker (green). right pane: overlayer of phospholipid-FITC and DRAQ5(blue)(as a cell nuclear marker). The colonic epithelium classification uses the same measurement units as shown in Figure 1-a, but with 1.75 μm as the thickness of surface and basal membranes. Magnification × 1000; scale bar-20μm. (a) Representative image of TLR4 expression E16.5, (b) E18.5 and, (c) postnatal days 1, (d) 3, (e) 21 and 10 weeks (f). (g) Negative control of an anti-mouse TLR4 in an E18.5 mouse fetal colonic section. (h) The average mean fluorescent intensity of TLR4 expression within the entire epithelial area (n=3-4 for each group, error bars represent SD, * p<0.05 vs. E16.5). (i) Histogram of the surface to cytoplasm ratio of TLR4 fluorescent intensity in mouse colonic sections (n=3-4 for each group, error bars represent SD, * p<0.05, **p<0.01, †P<0.001 vs. E16.5).

