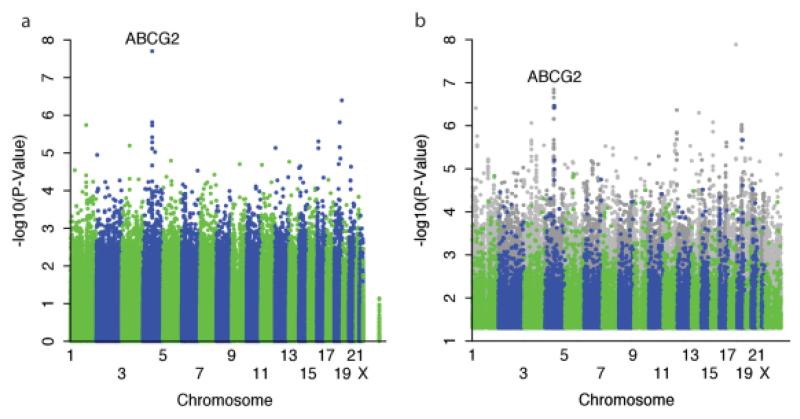
Figure 1.
Manhattan plot of association of SNPs with change in uric acid levels in response to allopurinol in (a) 1,492 patients with European ancestries or (b) all patients using a stratified transethnic meta-analysis. Meta-analysis was conducted combining individual associations of each of the four ethnic groups. Overall, this includes 1,607 non-Hispanic whites, 238 Asians, 84 African Americans, and 85 Hispanics. Gray dots are imputed SNPs. P-values > 0.05 were not plotted.

