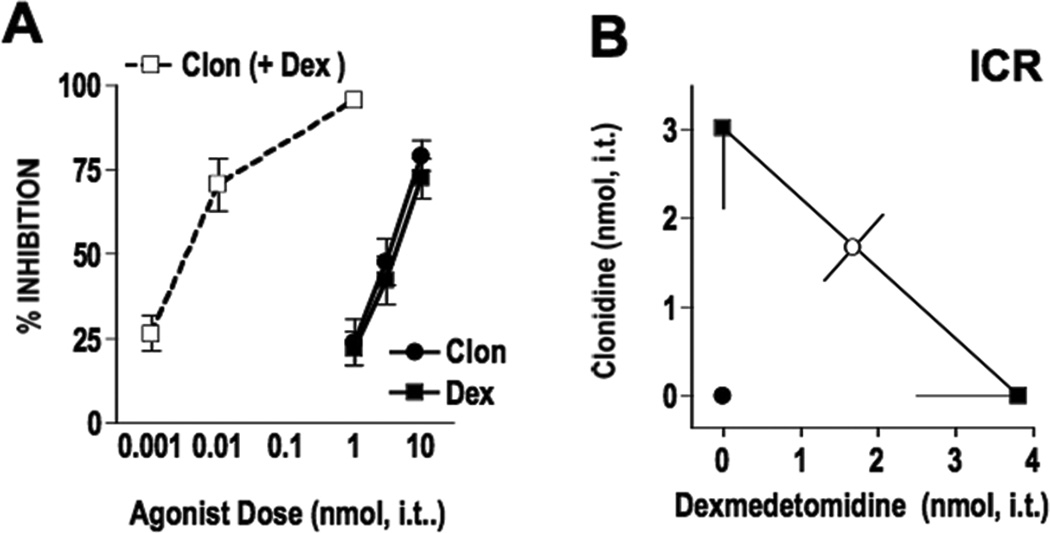
Figure 1. Clonidine and dexmedetomidine interact synergistically when given spinally to ICR (Institute of Cancer Research) mice.
A. Clonidine (●) and dexmedetomidine (■) inhibited substance P behavior in a dose-dependent manner. The agonists were then co-administered at a constant clonidine:dexmedetomidine dose ratio of 1:1 (□ clonidine (+dexmedetomidine)) based on the potency ratio between agonists. Note that the combination dose-response curves are plotted as the doses of clonidine used in the presence of dex. The corresponding “Dex (+ Clon)” curve is identical and not shown.. B. Isobolographic analysis applied to the data from Figure 1A. The y-intercept represents the ED50 for clonidine and the x-intercept represents the ED50 for dexmedetomidine. The observed combination ED50 (●) was significantly lower (p<0.05; t-test) than the theoretical additive ED50 (○), indicating that the interaction is synergistic in ICR mice. See Table 1 for ED50 values. Group sizes ranged from 5–8 mice.

