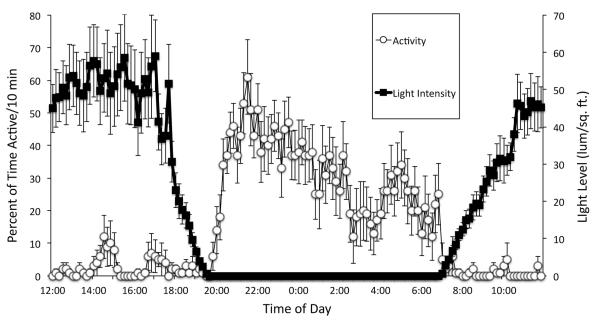
Figure 5.
The relationship between Melibe locomotion and ambient light levels. Data from 5 consecutive days are averaged and plotted (± SEM) for one sham-operated individual. Activity is calculated in terms of the percentage of each 10-min time interval that the animal was active. Note how strongly this animal’s behavior was influenced by the change in light intensity at sunset and sunrise.

