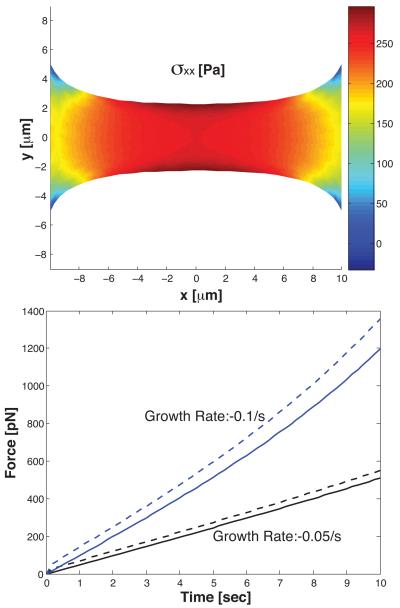
Fig. 4.
A shrinking strip of viscoelastic material is held between two fixed ends 20μm apart. The geometry of the strip and the xx-component of the stress tensor is shown. The material thins in the middle. The bottom plot shows the computed contractile force between the ends as a function of time for two shrinking rates. The solid line is when the dynamic viscosity, μ1, is 0. The dashed line is when μ1 = 30 Pa-s. We see that the viscous part of the stress makes a contribution if the relaxation time scale τ ≈ μ1/Y is comparable to the growth time scale.

