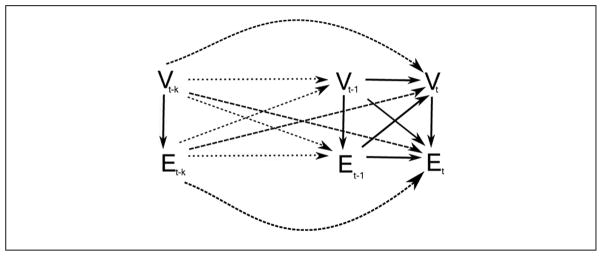
Figure 1.

A dependence diagram showing the cross-sectional vertex and edge sets under the assumptions of Appendix A, where t represents time and k represents the number of lags. The solid lines represent dependence at time t, with dashed lines representing dependence over k lags. The thickness of dashes distinguishes between the t and t − 1 cases.
