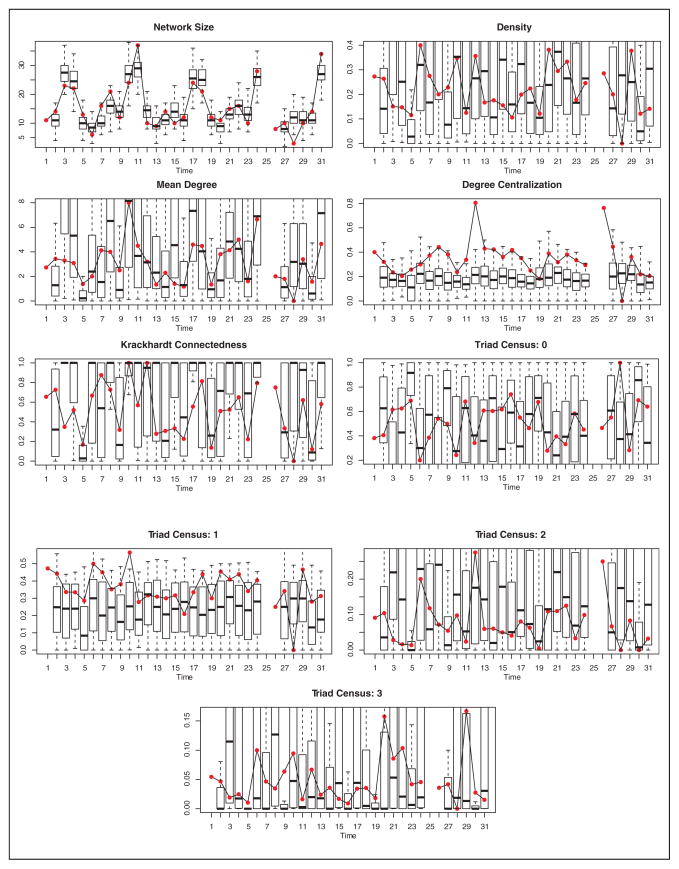
Figure 2.
Graph level index (GLI) comparison for the one-step dynamic network logistic regression prediction under an inhomogeneous Bernoulli assumption for model 4. Gray dots represent the observed GLI, and black box plots are the simulated distribution of the one-step prediction on the basis of the model 4 weights (100 simulated networks for each one-step prediction). Note that only 28 points are used in this analysis. This is because there is 1 missing time point, and we cannot perform one-step prediction on the first day of measurement or for the time point at which we lack the past day’s information.

