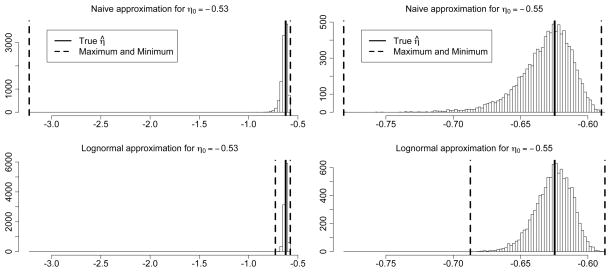
Figure 3.
Distribution of the approximate MLE for the final step of the example, for the naive approximation (top) and the lognormal approximation (bottom), for η0 = −.53 (on left) and η0 = −.55 (on right). The thick dashed lines indicate the minimum and maximum values found by each approximation, and the thick solid line marks the true MLE.

