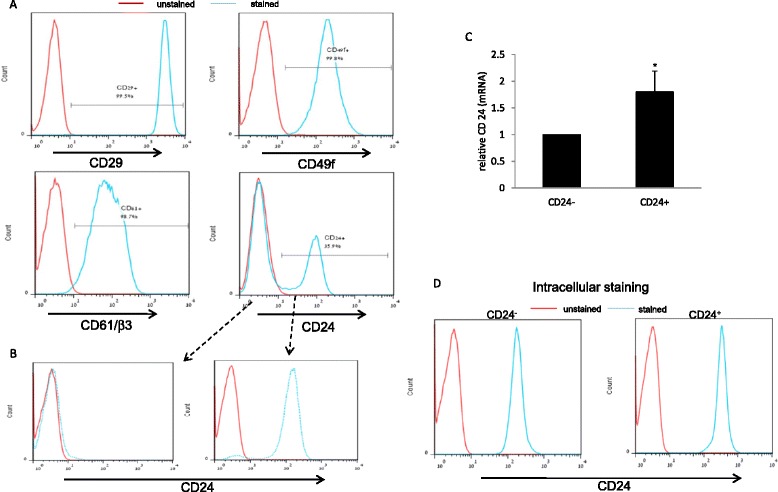
Fig. 1.

Isolation and characterization of two Mvt1 subgroups distinguished by their CD24 expression. a Fluorescence-activated cell sorting (FACS) showing CD29, CD49f, CD61/β3 and CD24 expression in the Mvt1 cell line. b Flow cytometric separation of Mvt1 cells based on CD24 expression. c RNA was extracted from the sorted CD24− and CD24+ populations for CD24 quantitative RT-PCR analysis. d FACS showing CD24 intracellular expression. The Mann-Whitney test was performed to compare CD24− and CD24+ cells. *p <0.05
