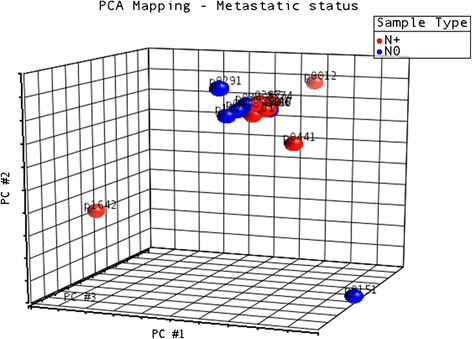
Fig. 5.

PCA plot depicting global small RNA expression in OSCC samples. For the clusterization of clinical samples based on the expression levels of small RNAs other that miRNAs we used Principal Components Analysis (PCA). All annotated molecules were included in this analysis. Results show that samples are very homogeneous concerning the expression of these small RNA molecules
