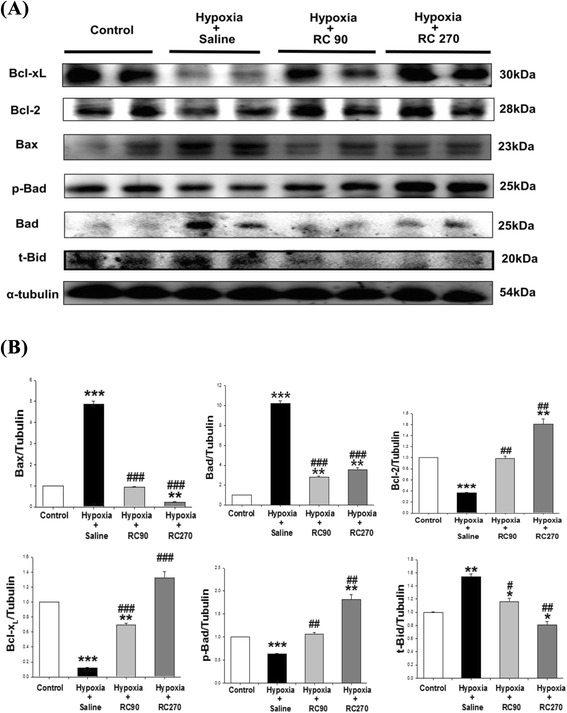
Fig 3.

a The representative protein products of Bcl-xL, Bcl2, Bax, p-Bad, Bad and t-Bid extracted from the left ventricles of excised hearts in the Control, the Hypoxia, the Hypoxia + RC90, and the Hypoxia + RC270 RC groups were measured by Western Blotting analysis. b The bars represent the relative protein quantification of Bcl-xL, Bcl2, Bax, p-Bad, Bad and t-Bid on the basis of α-tubulin and indicates Mean values ± SD (n = 6 in each group). *P < 0.05, **P < 0.01, ***P < 0.001, are the, significant differences from the Control. #P < 0.05, ##P < 0.01, ###P < 0.001are the significant differences from the Hypoxia group
