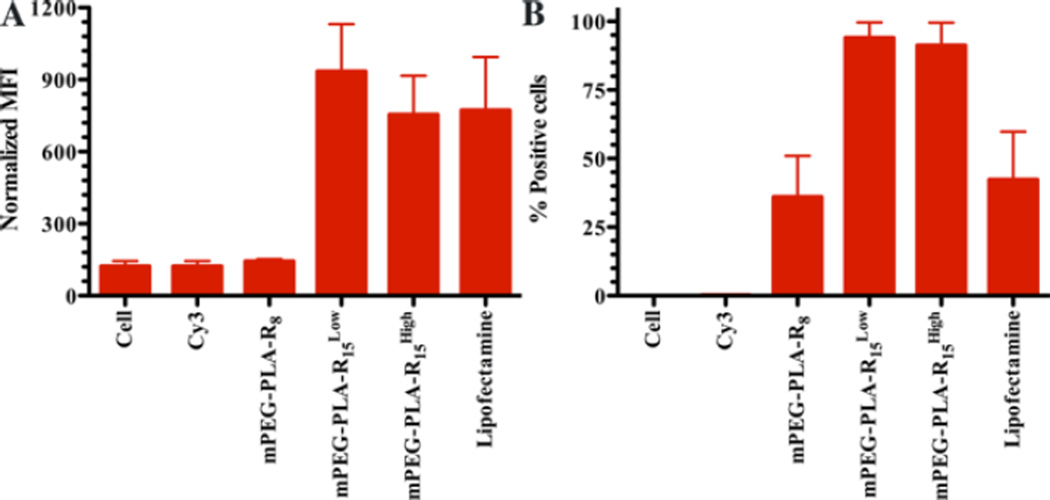
Figure 6. Cellular association mediated by different micelleplexes.
(A) The mean fluorescence intensity observed on U251 glioma cells following interaction with mPEG-PLA-R8, mPEG-PLA-R15Low, and mPEG-PLA-R15High micelleplexes or untreated cells or Cy3-labeled miRNA. (B) The relative population (%) of cells associated with the mPEG-PLA-R8, mPEG-PLA-R15Low, and mPEG-PLA-R15High micelleplexes or untreated cells or Cy3-labeled miRNA. N=3, mean ± standard error of the mean.

