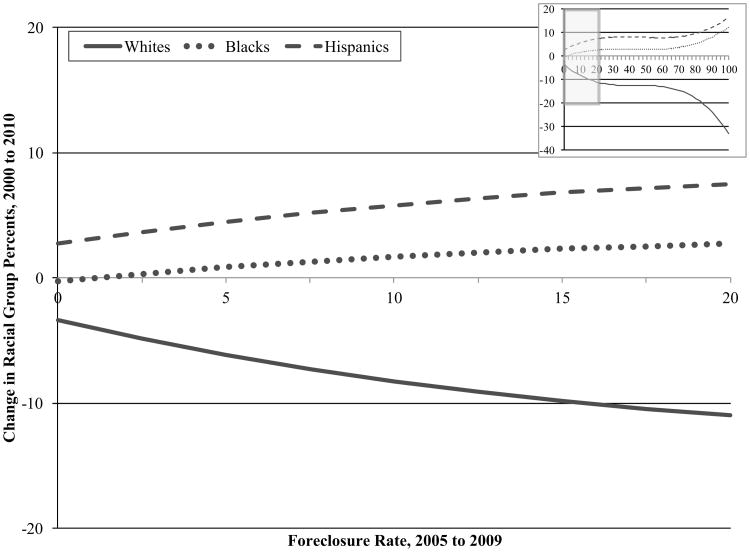
Figure 1. Association between Neighborhood Foreclosure Rates and Racial-Group Change.
Note: Predicted change based on Models 2 (for percent white), 5 (for percent black), and 8 (for percent Hispanic) in Table 2. The embedded figure in the top-right corner shows the association for the full distribution.

