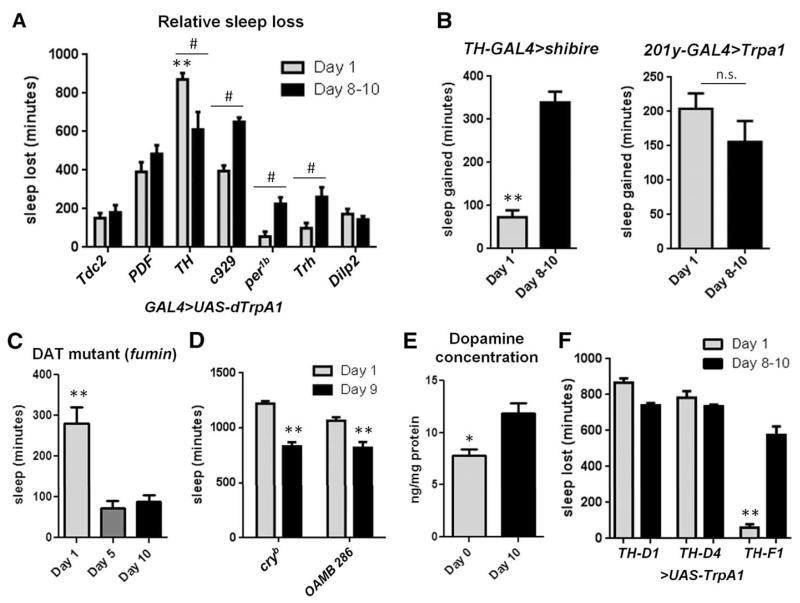
Fig. 2. Reduced dopamine signaling underlies ontogenetic sleep changes.
(A) Wake-promoting GAL4>UAS-dTrpA1 screen examining sleep loss compared to UAS controls in day-1 and day-8 to -10 flies at 28°C (**denotes comparison to all other day-1 GAL4>UAS-dTrpA1 measures; from left to right, n = 21, 12, 23, 12, 26, 12, 24, 23, 23, 24, 22, 24, 24, and 24 flies). (B) Sleep gained as compared to UAS controls in day-1 and day-8 to -10 flies at 29°C (TH-GAL4>shi: n = 23 day-1 flies, n = 22 day-8 to -10; 201y-GAL4>TrpA1: n = 18 day-1, n = 11 day-8 to -10). (C) Total sleep time in 24 hours in fumin flies at day 1, 5, and 10 (from left to right, n = 34, 20, and 28 flies). (D) Total sleep time in 24 hours at day 1 and day 9 in cryb and OAMB 286 flies (from left to right, n = 12, 12, 10, and 10 flies). (E) HPLC detection of dopamine concentration in fly brains (n = 4 separate replicates of 20 brains each). (F) Sleep loss in TH-restricted lines as compared to UAS controls in day-1 and day-8 to -10 flies at 29°C (from left to right, n = 12, 12, 11, 12, 40, and 11 flies). **P < 0.0001, # and *P < 0.05; two-way ANOVA with post-hoc Bonferroni multiple comparisons [(A) and (D)]; one-way ANOVA with Tukey’s post-hoc test [(C) and (F)]; and unpaired two-tailed Student’s t test (E); plus Welch’s correction (B).

