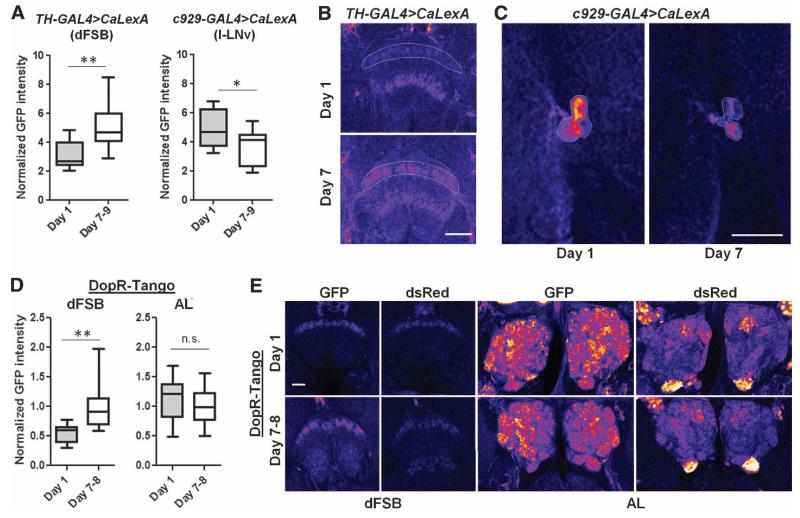
Fig. 3. Hypoactivity of dFSB-projecting dopaminergic neurons in young flies.
(A) Normalized GFP intensity of the indicated brain region in GAL4>UAS-CaLexA flies of different ages (TH-GAL4: n = 13 at both ages; c929-GAL4: n = 14 day-1, n = 15 day-7 to -9). Representative images of (B) the dFSB and (C) large LNvs in brains immunostained for GFP. GFP is pseudocolored “fire.” Warmer colors reflect increased signal intensity. Scale bars, 37.5 μm. (D) Normalized GFP intensity in DopR-Tango flies in the dFSB and AL (dFSB: n = 22 day-1 flies, n = 25 day-7 to -8; AL: n = 34 day-1, n = 49 day-7 to -8). (E) Representative images of the dFSB and AL in DopR-Tango flies. Endogenous GFP and dsRed are pseudocolored fire. Scale bar, 20 μm. Box plots in this figure and all others represent the median value (horizontal line inside box), interquartile range (height of the box, 50% of the data within this range), and minimum and maximum value (whiskers). **P < 0.0001, *P < 0.05; unpaired two-tailed Student’s t test plus Welch’s correction [(A) and (D)].

