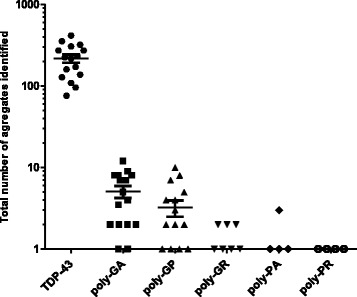
Fig. 2.

Frequency of TDP-43 and DPR inclusion per case, per section. The number of TDP-43 and DPR immunoreactive inclusions was counted for each case and normalised per spinal cord section. The graph shows the number of TDP-43 and the five different aggregates in order of abundance. There are many more TDP-43 aggregates than any DPR. Note: The Y axis scale is logarithmic scale. Horizontal bars show mean ± SEM
