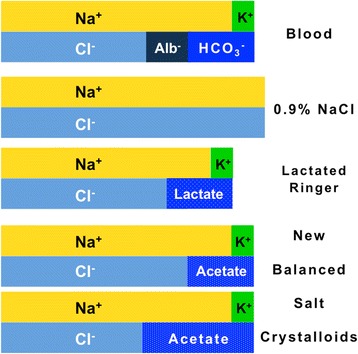
Fig. 1.

Semi-quantitative Gamble’s diagram representing the Na+-, K+-, Cl--, base- and albuminate-concentration in blood, 0.9 % saline solution, lactated Ringer’s solution and so-called more “balanced” salt crystalloids. The Na+-concentration is higher in 0.9 % saline (≈155 mmol/L) and lower in lactated Ringer (≈130 mmol/L) than in blood (≈140 mmol/L). On the contrary, the concentration of this cation is almost identical in the “balanced” salt crystalloids and in blood (≈140 mmol/L). The Cl--concentration is higher in 0.9 % saline (≈155 mmol/L), in lactated Ringer (≈110 mmol/L) and in the “balanced” salt crystalloid (≈125 mmol/L) containing acetate ≈ 25-30 mmol/L than in blood (≈100 mmol/L). The concentration of this anion is similar in the “balanced” salt crystalloid containing acetate ≈ 50 mmol/L and in blood (≈100 mmol/L). For simplicity purposes, calcium, magnesium and inorganic phosphate are omitted
