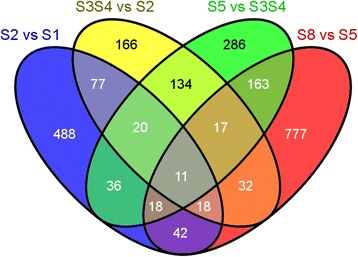
Fig. 3.

Venn diagram illustrating the number of transcripts differentially expressed between two consecutive stages of development

Venn diagram illustrating the number of transcripts differentially expressed between two consecutive stages of development