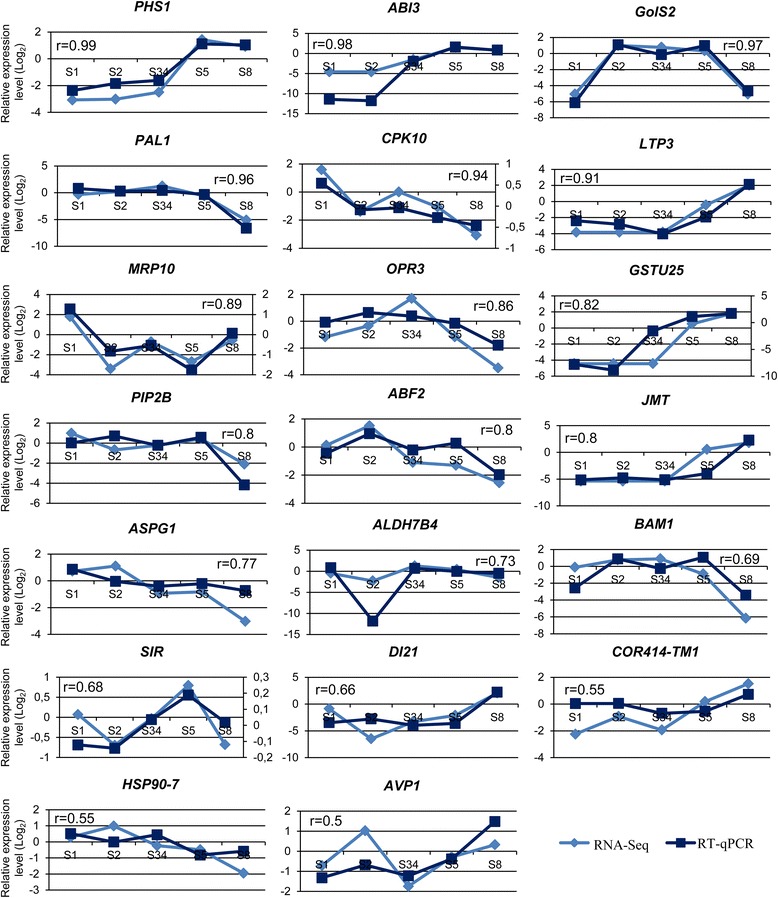
Fig. 5.

Validation of the RNA-Seq transcript profiles. Comparison of transcripts expression patterns from RNA-Seq data and from reverse transcription quantitative real-time PCR (RT-qPCR). In the y-axis it is represented the Log2 of the relative expression level in each developmental stage and the five acorn developmental stages are represented in the x-axis. The numbers above the graphics correspond to the values obtained with the Pearson correlation
