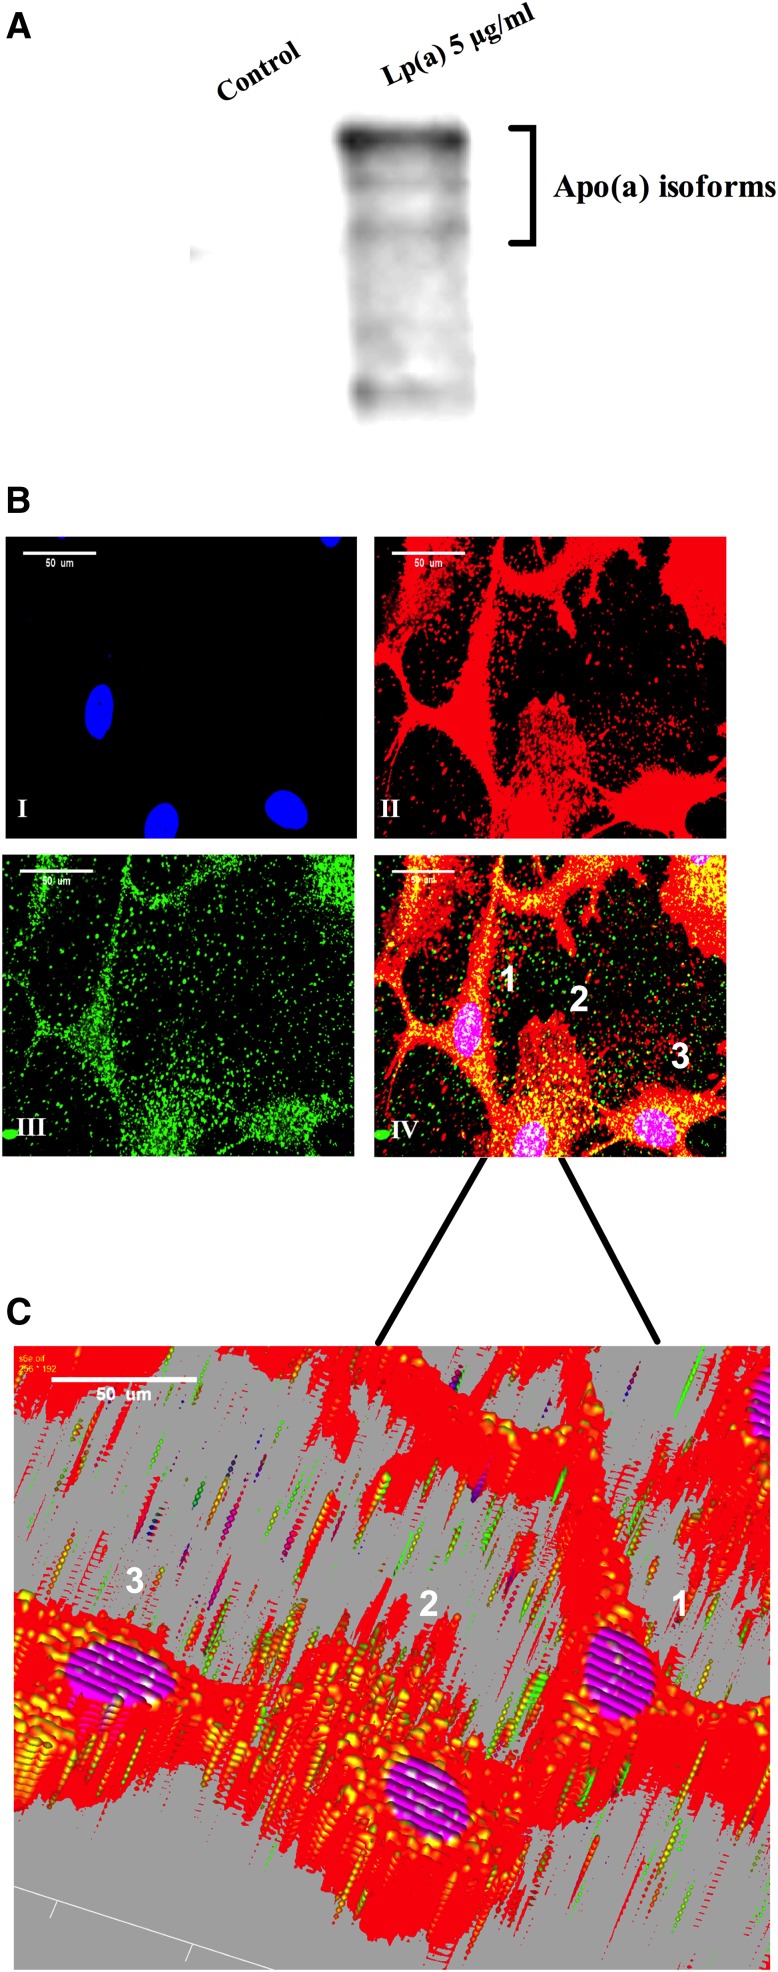
Fig. 4.
Lp(a) is internalized by HepG2 cells. A: Western blot of untreated control and 5 μg/ml Lp(a) protein-treated HepG2 cell lysates using an anti-apo(a) antibody. B: Confocal microscopy of Lp(a)-treated HepG2 cells stained with DAPI nuclear stain (I), AlexaFluor 594 WGA membrane stain (II), and the anti-apo(a) monoclonal antibody, a5, detected with AlexaFluor 488 anti-IgG (III). The merged image of all three stains is shown in (IV). Scale bar = 50 μm. C: 3D image after z stacking of the merged image. Ten slices of 0.5 μm thickness were taken through each cell and z-stacked using Olympus FluoView™ FV1000 Image Examiner software. In each case at least 100 cells were analyzed per condition across three independent experiments.

