
Fig. 1.
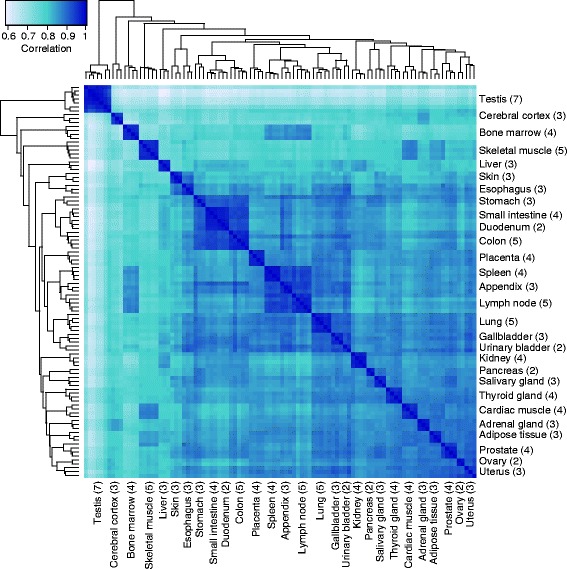
Hierarchical clustering of human tissues. The relationship between the 100 tissue samples corresponding to 28 different tissues, based on pairwise Spearman correlations
Official websites use .gov
A
.gov website belongs to an official
government organization in the United States.
Secure .gov websites use HTTPS
A lock (
) or https:// means you've safely
connected to the .gov website. Share sensitive
information only on official, secure websites.
Hierarchical clustering of human tissues. The relationship between the 100 tissue samples corresponding to 28 different tissues, based on pairwise Spearman correlations