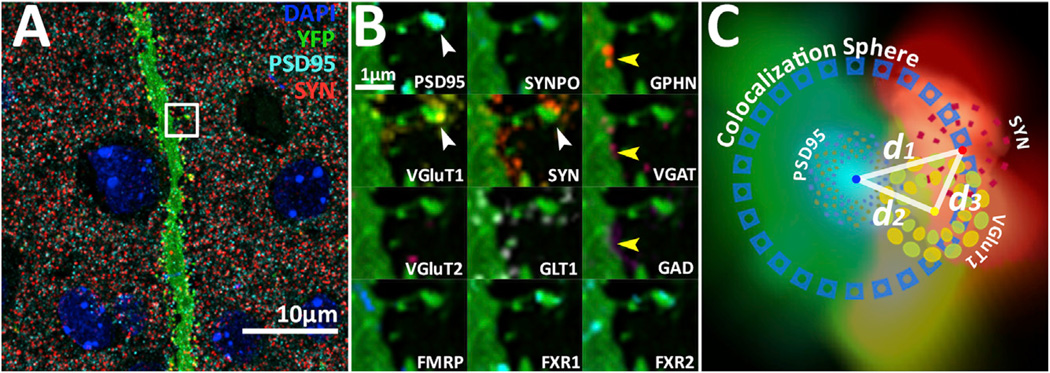
Figure 1. Detection and Classification of Synapses from Multichannel Array Tomographic Volume Images.
(A) Composite maximum intensity projection illustrating the density of synaptic protein puncta in layer 4 cortex. Blue, DAPI; green, YFP; cyan, PSD95; red, SYN; and yellow, VGluT1. Scale bar, 10 µm. White arrowhead points at a dendritic spine with a glutamatergic VGluT1-containing synapse. Yellow arrowhead points at a dendrite shaft GABAergic synapse. Projected volume: 0.3 mm by 0.3 mm by 2 µm.
(B) Zoomed-in views of dendrite segment marked by white box in (A). Each box contains only one protein marker as labeled in the lower left of each box. Note the orientation of the synaptic markers, where postsynaptic and presynaptic molecules are spatially organized in a specific pattern. Also, note how the synapse present on the spine can be classified as a VGluT1 synapse based on the presence of VGluT1 and the absence of VGluT2.
(C) Schematic of distance calculations made for synapse analysis superimposed on 2D projection of a volumetric rendering of the excitatory synapse in ([B], white arrowhead). Distance between the center of mass from PSD95 and SYN (d1) is used to generate a colocalization sphere for the determination of protein colocalization (e.g., if the distance of a VGluT1 center to PSD95 [d2] is smaller than [d1], then that punctum is considered colocalized to the candidate synapse). The verification of the candidate synapse represented by the PSD95-to-SYN pair is made if the distance of the VGluT1 center to PSD95 (d2) is longer than the distance of the VGluT1 center to SYN (d3), signifying that the VGluT1 is presynaptic.

