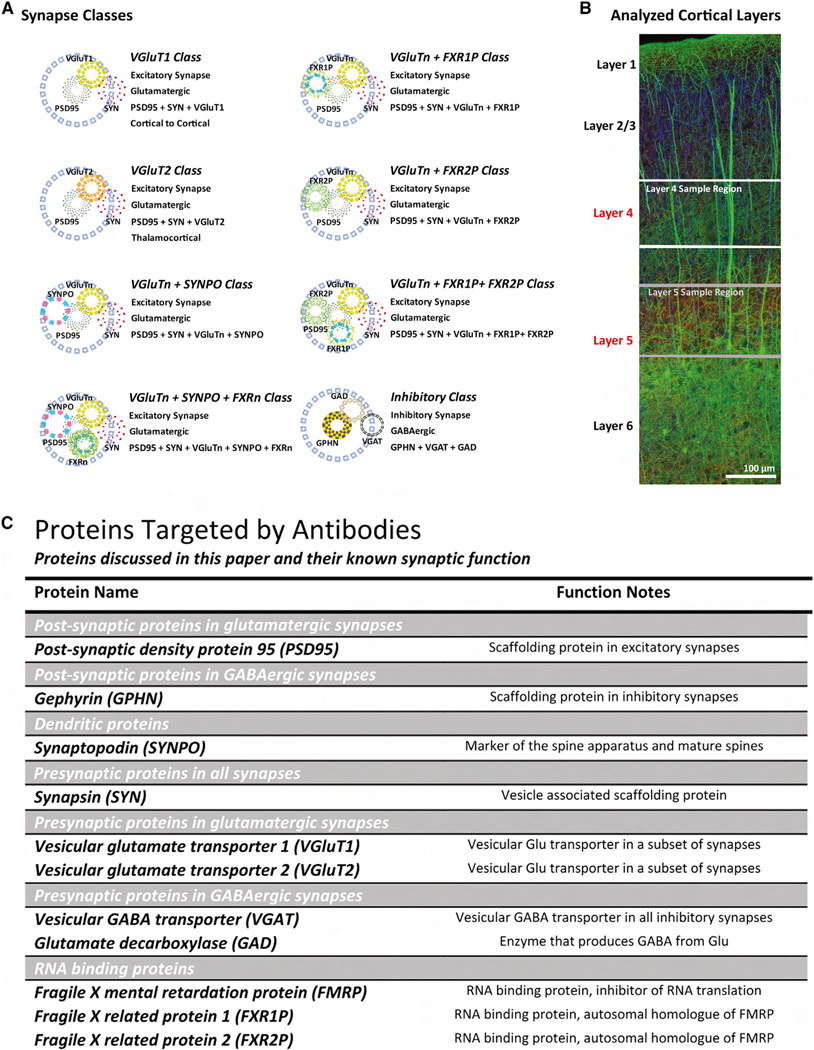
Figure 2. Cortical Layers, Synapse Classes, and Synaptic Proteins Analyzed in This Study.
(A) Schematic representation of synapse classes. Blue circle represent the colocalization sphere. VGluTn, VGluT1 and VGluT2. FXRn, FXR1 and FXR2.
(B) Cortical Layers 4 and 5 are selected for analysis because sensory processing deficits are important behavioral abnormalities seen in FXS. Image: YFP, green; acetylated tubulin, blue; and SYN, red.
(C) Table of proteins discussed in this paper and their known synaptic function.

