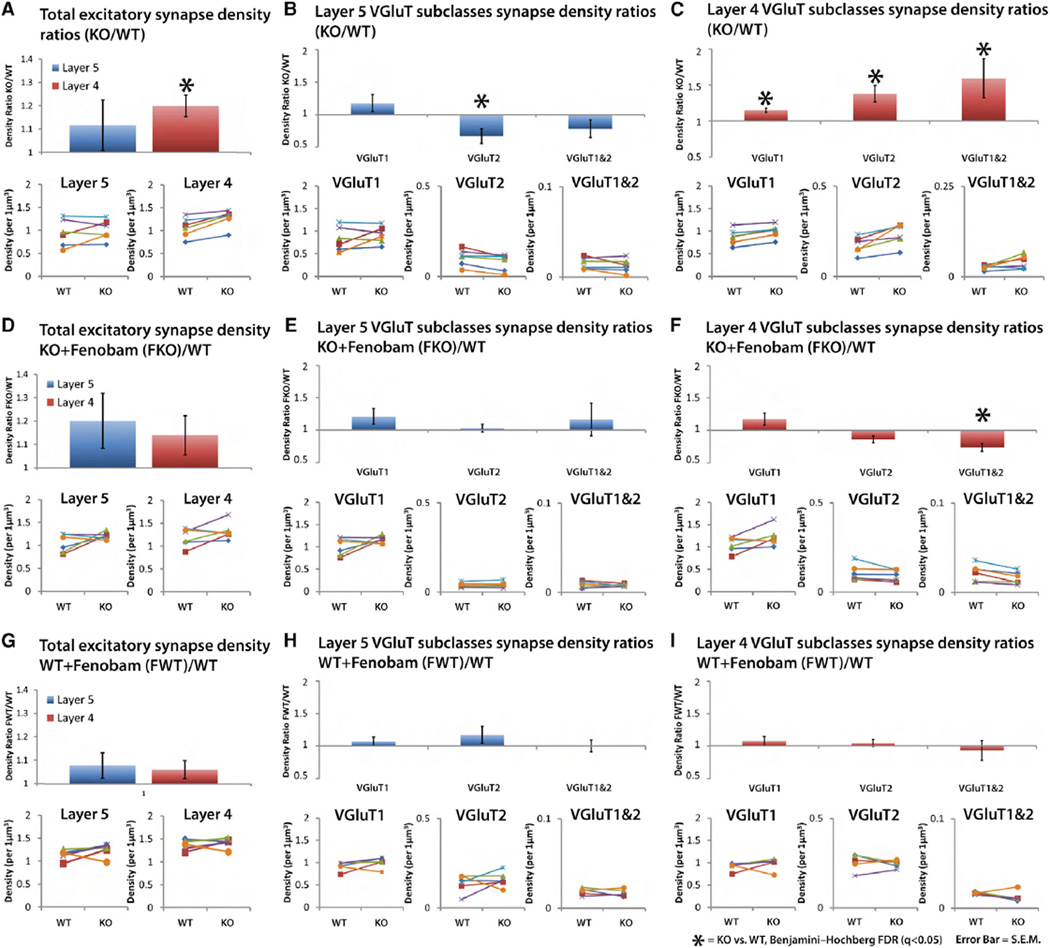
Figure 3. Density Comparison of Synapses Reveals Layer- and Class-Specific Response to FMRP Loss and Fenobam Treatment.
(A–I) Average density ratio of KO versus WT synapses from paired mice tissue (see Experimental Procedures). Paired tissue is used to reduce variability in tissue processing and immunolabeling.
(A) Density ratios of KO/WT for the total excitatory synapse population in layers 5 and 4. Layer 4 synapse density is increased in the KO, but in not layer 5. (Insets) The densities of each individual KO/WT pairs are plotted (n = 6 pairs).
(B) Density ratios for layer 5 VGluT synapse classes and their plotted individual densities. There is a specific decrease in VGluT2 synapse density in layer 5.
(C) Density ratios for layer 4 VGluT synapse classes and their plotted individual densities. Synapse density is increased in all classes.
(D) Density ratios of fenobam-treated KO (FKO)/WT for the total excitatory synapse population in layers 5 and 4 (n = 6 pairs). Fenobam rescues layer 4 density increases in KO.
(E) Density ratios (FKO/WT) of layer 5 VGluT synapse classes. Fenobam normalizes the specific VGluT2 synapse density increase in layer 5.
(F) Density ratios of Layer 4 VGluT synapse classes. Fenobam normalizes density increases, except for VGluT1 and 2 class synapses.
(G–I) Density ratios of fenobam-treated WT (FWT)/WT for the total excitatory synapse population in layers 5 and 4 (n = 5 pairs). Fenobam does not induce significant change in synapse density in the WT. Error bars, SE. Significance is calculated using paired t tests, and the p values are adjusted via Benjamini-Hochberg false discovery rate (FDR) test. q < 0.05.

