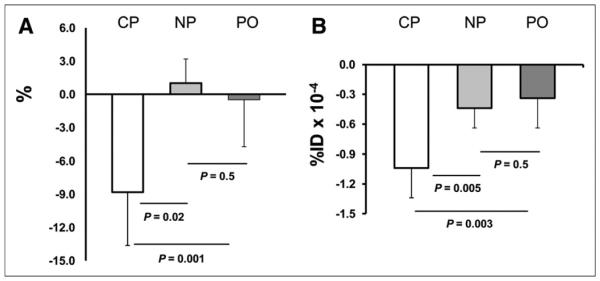
FIGURE 3.

Imaging data. (A) Shown is reduction in ischemic defect (IS) as percentage left ventricle from day 1 to day 7 in 3 groups. Defect was reduced in area in CP group, whereas there were small changes in the 2 control groups. (B) Reduction in 99mTc-annexinV uptake from day 1 to day 7 in 3 groups. Reduction in tracer uptake in defect region is greater in CP than in NP or PO groups, and there is no change between NP and PO groups.
