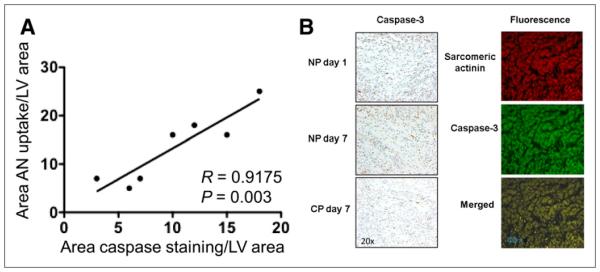
FIGURE 5.

(A) Graph shows correlation between 99mTc-annexin V uptake as percentage area of left ventricle (from region-of-interest analysis) and percentage area of caspase staining from quantitative immunostaining of tissue from animals that were sacrificed after scans. (B) Histologic sections are shown for apoptosis staining light microscopy sections of myocardium in risk region from control rat at day 1 and day 7 and from CP rat at day 7 (left) and immunofluorescence-stained sections from a day 1 CP experiment with staining for sarcomeric α-actinin in red, caspase-3 in green, and two merged in yellow (right). At day 1, there are more positive-stained cells than at day 7, and at day 7 there are fewer positive-stained cells for CP than for NP experiments. Caspase-3 colocalizes with myocytes. AN = annexin.
