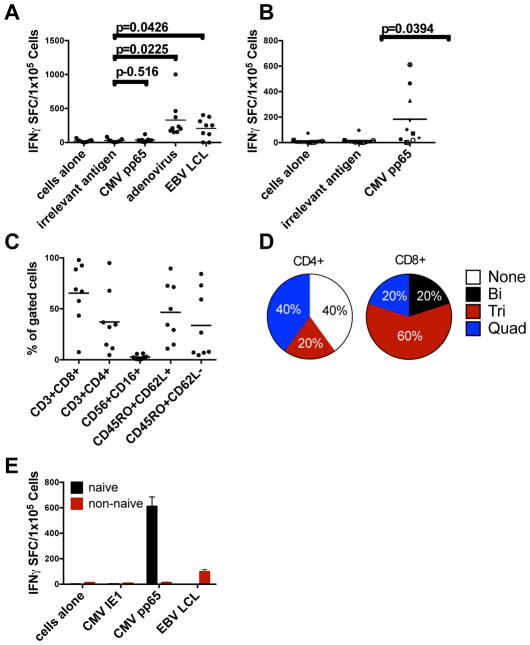
Figure 1. CMV-specific T-cells expanded from CMV-seronegative donors.
(A) Specificity of EBV-, CMV-, and adenovirus-specific T-cells from CMV-seronegative donors over 16 to 23 days as shown by an IFN-γ ELISPOT assay. (B) CMV specificity of T-cells expanded by enriching for naïve T-cells and using overlapping peptides of CMVpp65. Lines were considered positive if they were >5 spots above the negative control with confirmatory individual peptide pools when possible. (C) Phenotype of cells shown in Panel B. (D) Polyfunctionality of five of the responding T-cell lines as determined by intracellular or surface staining. Positive cells were counted as >2% above background staining. The markers tested were IFN-γ, TNF-α, GM-CSF, CD40L and IL-2. (E) Derivation of CMVpp65-specific T-cells from the naïve population. Before stimulation, CD3+ T-cells were sorted for CD45RA+/CCR7+ cells (naïve) and CD45RA-/CCR7- (“non-naïve”) cells, and were then stimulated as indicated and tested for specificity to CMVpp65 and EBV-LCLs. T-cells derived from the naïve fraction are shown in black and the non-naïve fraction in grey. Error bars represent the standard deviation from the mean. *P<0.005 versus non-naïve by two-tailed t-test. In panels A–C, each symbol represents a T-cell line taken from 10 CMVneg donors and the grey bars indicate the mean.

