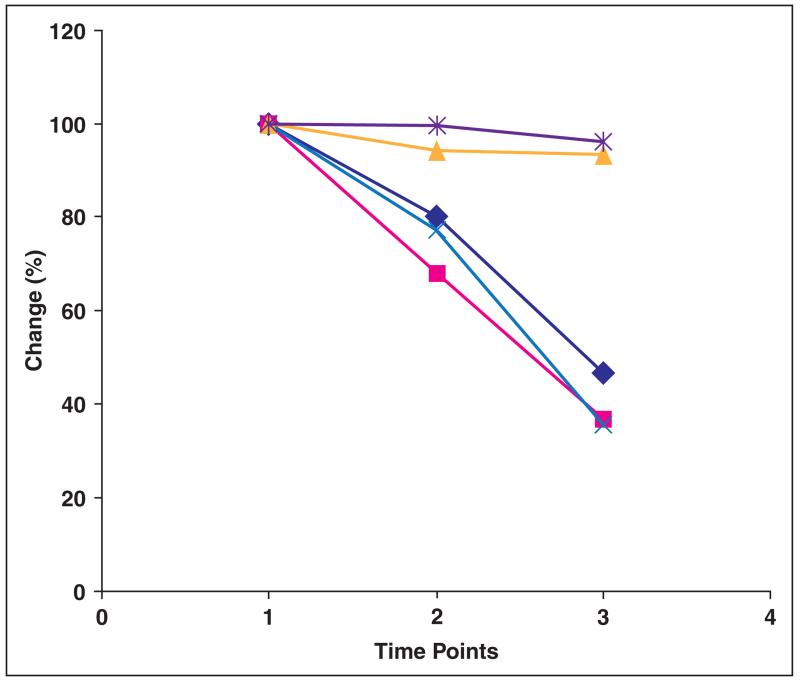
Fig. 2.
Chart shows change in perfusion parameters and tumor size from baseline (time point 1) to 2 weeks after start of bevacizumab therapy (time point 2) and after completion of treatment (time point 3). Chart shows percentage change in each of parameters compared with baseline. Dark blue line indicates blood flow, pink line indicates blood volume, yellow line indicates mean transit time, light blue line indicates permeability surface area product, and purple line indicates RECIST (Response Evaluation Criteria in Solid Tumors).

