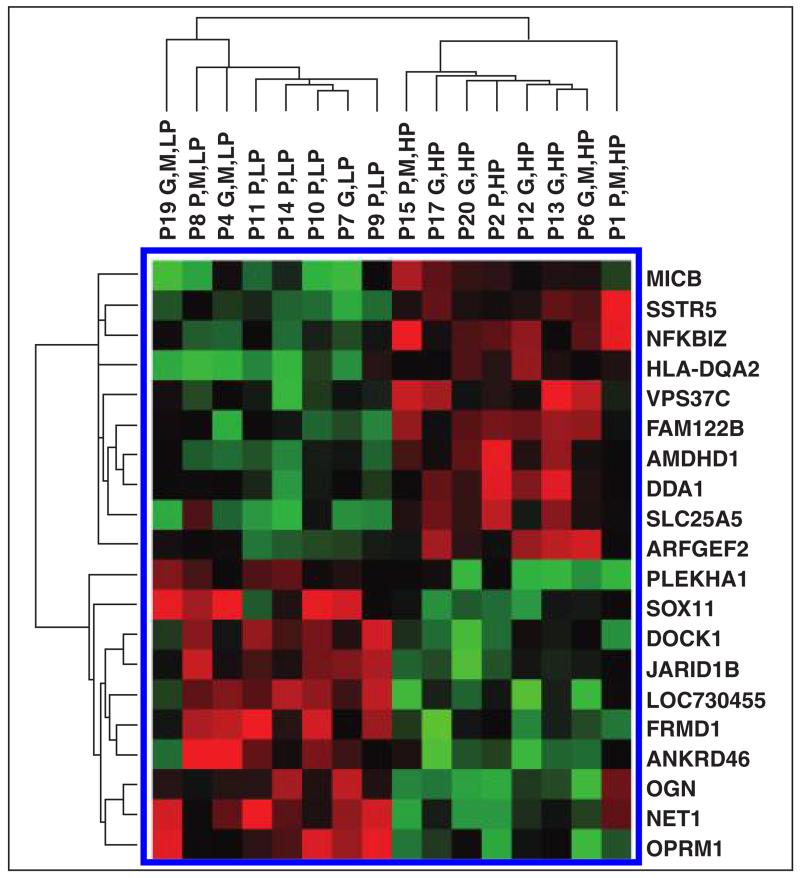
Fig. 4.
Gene expression microarray image shows that expression of 20 gene classifiers identified from k-nearest neighbors–leave-one-out cross-validation test could segregate patients with high baseline tumor perfusion and low baseline perfusion. Patient number is given for each sample. Color bar shows extent of normalized expression intensities in heat map, Red and green indicate high and low expression, respectively.

