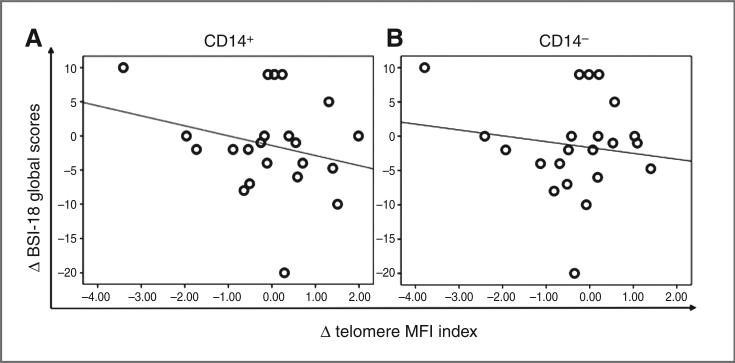
Figure 4.
Longitudinal association of chronic stress response and telomere index of CD14+ and CD14− subsets. A, correlation plot of longitudinal changes in BSI-18 global raw scores and telomere length MFI index of CD14+ subsets (N = 22), showing that decreased distress was associated with increased telomere length. Data points reflect longitudinal change from baseline to T2, Pearson correlation coefficient, r = −0.46, P 0.043, 2-sided analysis; plot features least-squares regression line. B, correlation plot of longitudinal changes in BSI-18 global raw scores and telomere length MFI index of CD14− subsets (N = 22), showing that decreased distress was associated with increased telomere length. Data points reflect longitudinal change from baseline to T2, Pearson correlation coefficient, r = 0.36, P = 0.1, 2-sided analysis; plot features least-squares regression line. These analyses were controlled for age and baseline telomere length.

