Figure 10.

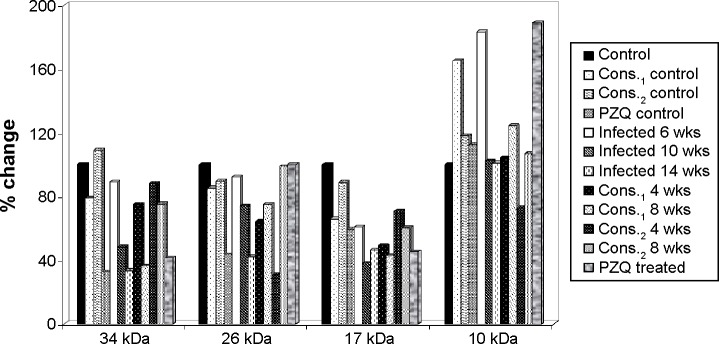
The percentage change in high MW protein fractions (34, 26, 17, and 10 kDa) in mice serum of D-mannitol- and pectin-treated groups as compared to control group.

The percentage change in high MW protein fractions (34, 26, 17, and 10 kDa) in mice serum of D-mannitol- and pectin-treated groups as compared to control group.