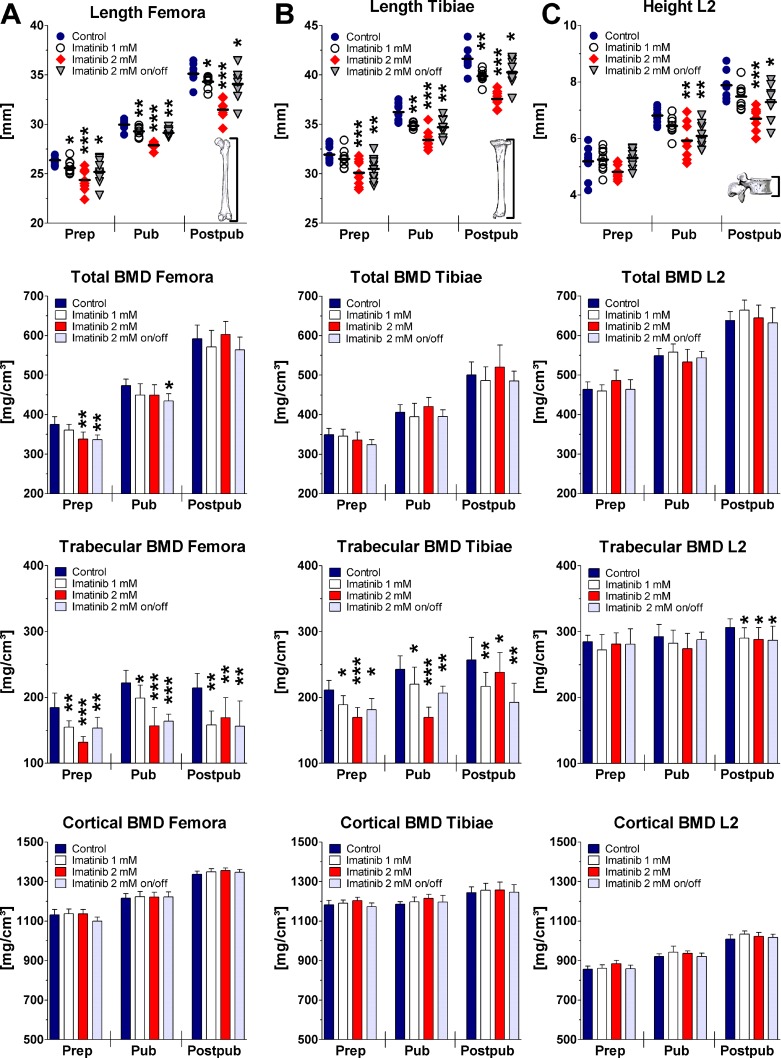
Fig 2. Bone length, total BMD, trabecular BMD, and cortical BMD of the femora (A), tibiae (B), and vertebra L2 (C) during long-term imatinib exposure assessed by pQCT.
BMD = bone mineral density; Prep = prepubertal (age of rats: 6 weeks, duration of exposure: 2 weeks; n = 10 each group); Pub = pubertal (age of rats: 8 weeks, duration of exposure: 4 weeks; n = 8 each group); Postpub = postpubertal (age of rats: 14 weeks, duration of exposure: 10 weeks; n = 8 each group); Data represents mean ± 95% CI. Statistical analysis at defined time points: * p<0.05 versus age-related controls; ** p<0.01 versus age-related controls; *** p<0.001 versus age-related controls.

