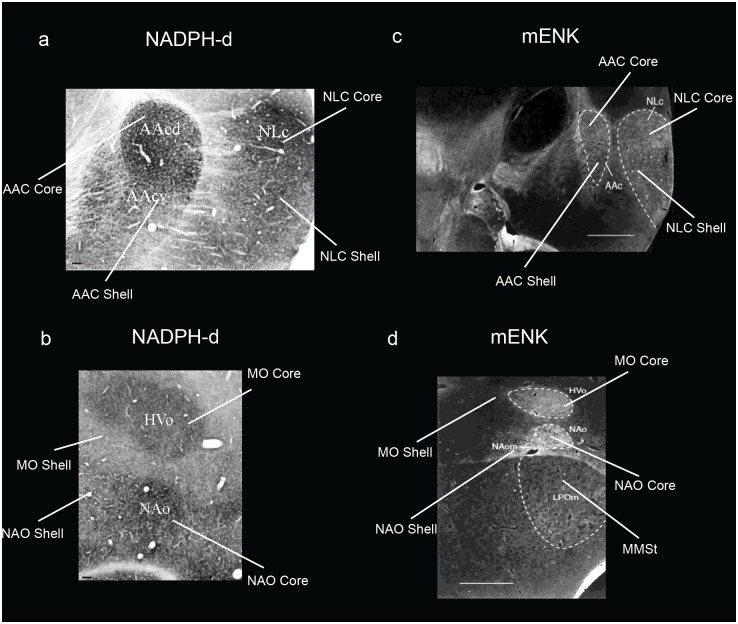
Fig 9. Brightfield and darkfield photomicrographs showing specialized NADPH-d and mENK staining in budgerigar song nuclei.
(a-b) Brightfield photomicrographs showing higher NADPH-d staining in the NLC, AAC, MO, and NAO cores, and moderate specialized expression in the NLC, AAC, and MO shells. (c-d) Darkfield photomicrographs showing higher mENK staining in the NLC, AAC, MO, and NAO cores, and more moderate levels in the shells. Figures adapted from Brauth et al. [57] and Durand et al. [58], and reproduced with permission from S.E. Brauth and S.E. Durand. Abbreviations inside the images were based on an older nomenclature at the time. Sections are in the coronal plane; medial is to the left, dorsal is top. Scale bars = 100 μm in a—b, and 1mm in c—d.

