
Fig 3. MEG decoding for animacy.
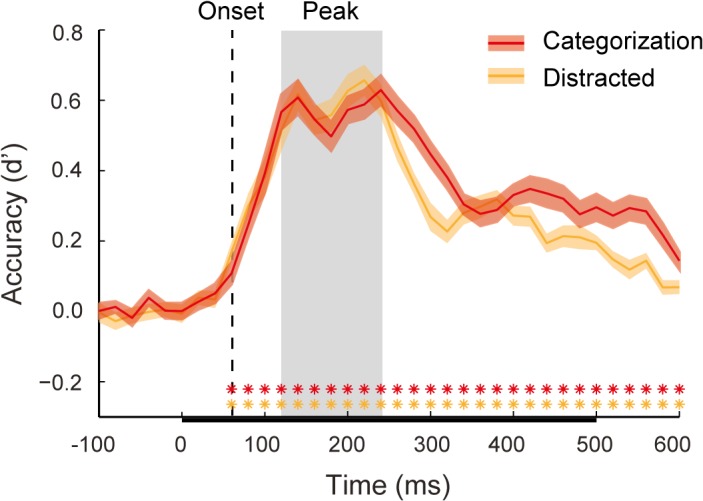
Mean classifier performance (d’) for both the categorization task (red) and distracted viewing task data (orange) plotted over time. Shaded regions above and below the mean lines indicate +/- 1 SEM across subjects. Color-coded asterisks indicate time points at which classifier performance was significantly above chance, using a Wilcoxon signed rank test (* = false discovery rate (FDR) adjusted p < 0.05). Decoding onset for both data sets (60ms) is indicated by a dashed vertical line. The period of peak decoding is indicated by a gray box extending 120–240 ms post-stimulus onset. The bar along the x-axis indicates the stimulus duration.