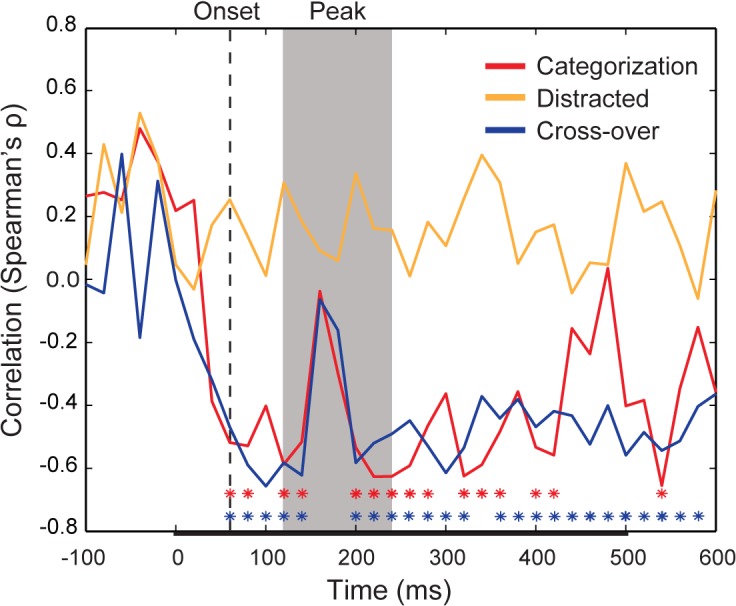
Fig 4. Time-series correlation between representational distances from the animacy boundary and categorization task reaction times.

The time-varying rank-order correlation (Spearman’s ρ) between the average object exemplar representational distance and average reaction time across subjects for the categorization task (red), distracted viewing task (orange), and cross-over between the tasks (blue), in which representational distances from the distracted viewing task were correlated with the median RTs for the categorisation task. Color-coded asterisks indicate time points at which a correlation between distance and RT achieves significance (* = FDR adjusted p < 0.05). The decoding onset is indicated by dashed vertical line (60 ms). The period of peak decoding is indicated by the gray shaded region extending from 120–240 ms post-stimulus onset. The bar along the x-axis indicates the stimulus duration.
