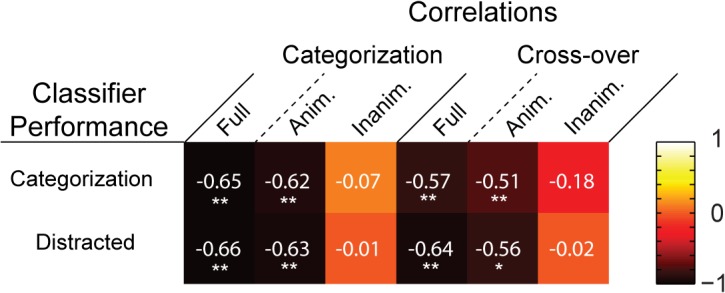
Fig 5. Matrix of correlations between decoding time-courses and representational distance-RT correlation time-courses.

The “heat” of each tile reflects the strength of the rank-order correlation (Spearman’s ρ) between a decoding time-course and a representational distance-RT correlation time-course. Asterisks indicate significant correlations (* = p < .01; ** = p < .001).
