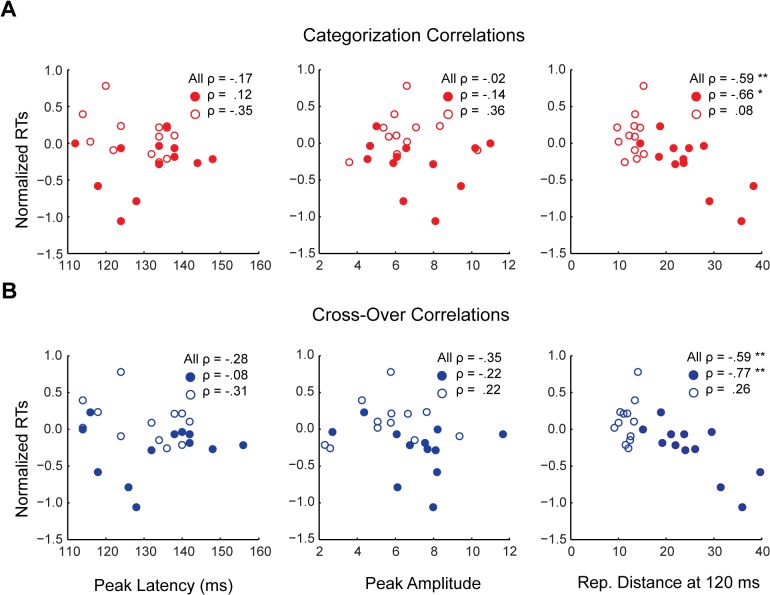
Fig 8. Correlations between sensory peak latencies and amplitudes and categorization task RTs.
Scatter plots for the rank-order (A) categorization and (B) cross-over correlations (Spearman’s ρ) between peak latency and peak amplitude and median normalized RTs for the categorization task. (A) Red circles indicate animate exemplar data points, while red rings indicate inanimate data points. (B) Blue circles indicate animate exemplar data points, while blue rings indicate inanimate data points. Peak amplitude scale is in units of 10−14 T. For comparison also plotted are the correlations between representational distance and RTs at 120 ms. Asterisks indicate significant correlations (* = p < .01; ** = p < .001).

