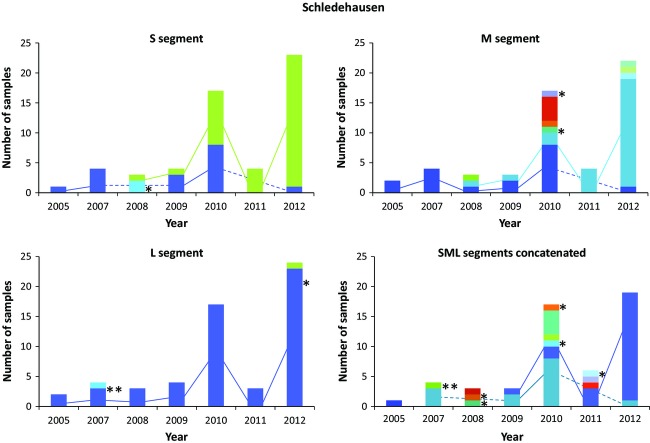
Figure 5.
Persistence of Puumala virus types in the Schledehausen vole population for each genome segment and the three segments concatenated. The colors indicate different virus sequence types, and the lines connect the same virus type in different years. Asterisks indicate virus types with nonsynonymous substitutions. For analogous plots for the Astrup population, see Figure S2 in the Supplementary Material.

