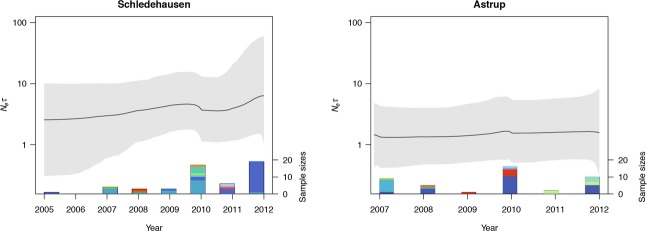
Figure 6.

Bayesian skyline plots of effective population sizes of the Puumala virus populations Schledehausen and Astrup, based on concatenated S, M, and L segment sequences. The black line represents the mean estimate of the effective population size, and the gray area marks the highest posterior density interval. Bars on the x-axis indicate the number of virus sequences obtained at the respective locality in each year (right y-axis), and the colors indicate different virus sequence types.
