
Figure 1.
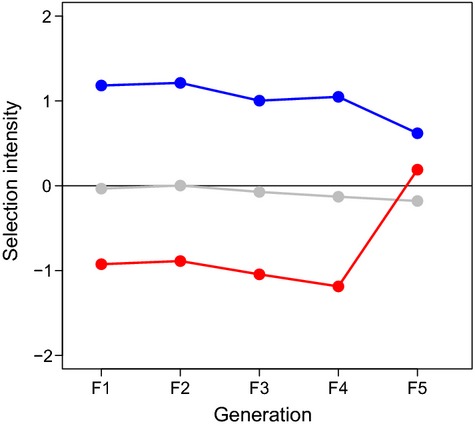
Standard deviation-standardized selection differential (S; also known as the selection intensity) estimated for each generation separately. Red, gray, and blue symbols and lines represent populations of small, random, and large fish, respectively.